Understanding Your NBU Bill
New Braunfels Utilities: Understanding Your Bill
Your utility bill brings together important information about your services, usage, and charges. We’re here to help you understand what you’re paying for, how your charges are calculated, and how to use your bill as a helpful tool—not a confusing one.
Important to note: The City of New Braunfels provides garbage and recycling services. New Braunfels Utilities bills for these services on the City’s behalf. If you have questions or issues with these services or related charges, contact the City’s Garbage and Recycling Department directly.
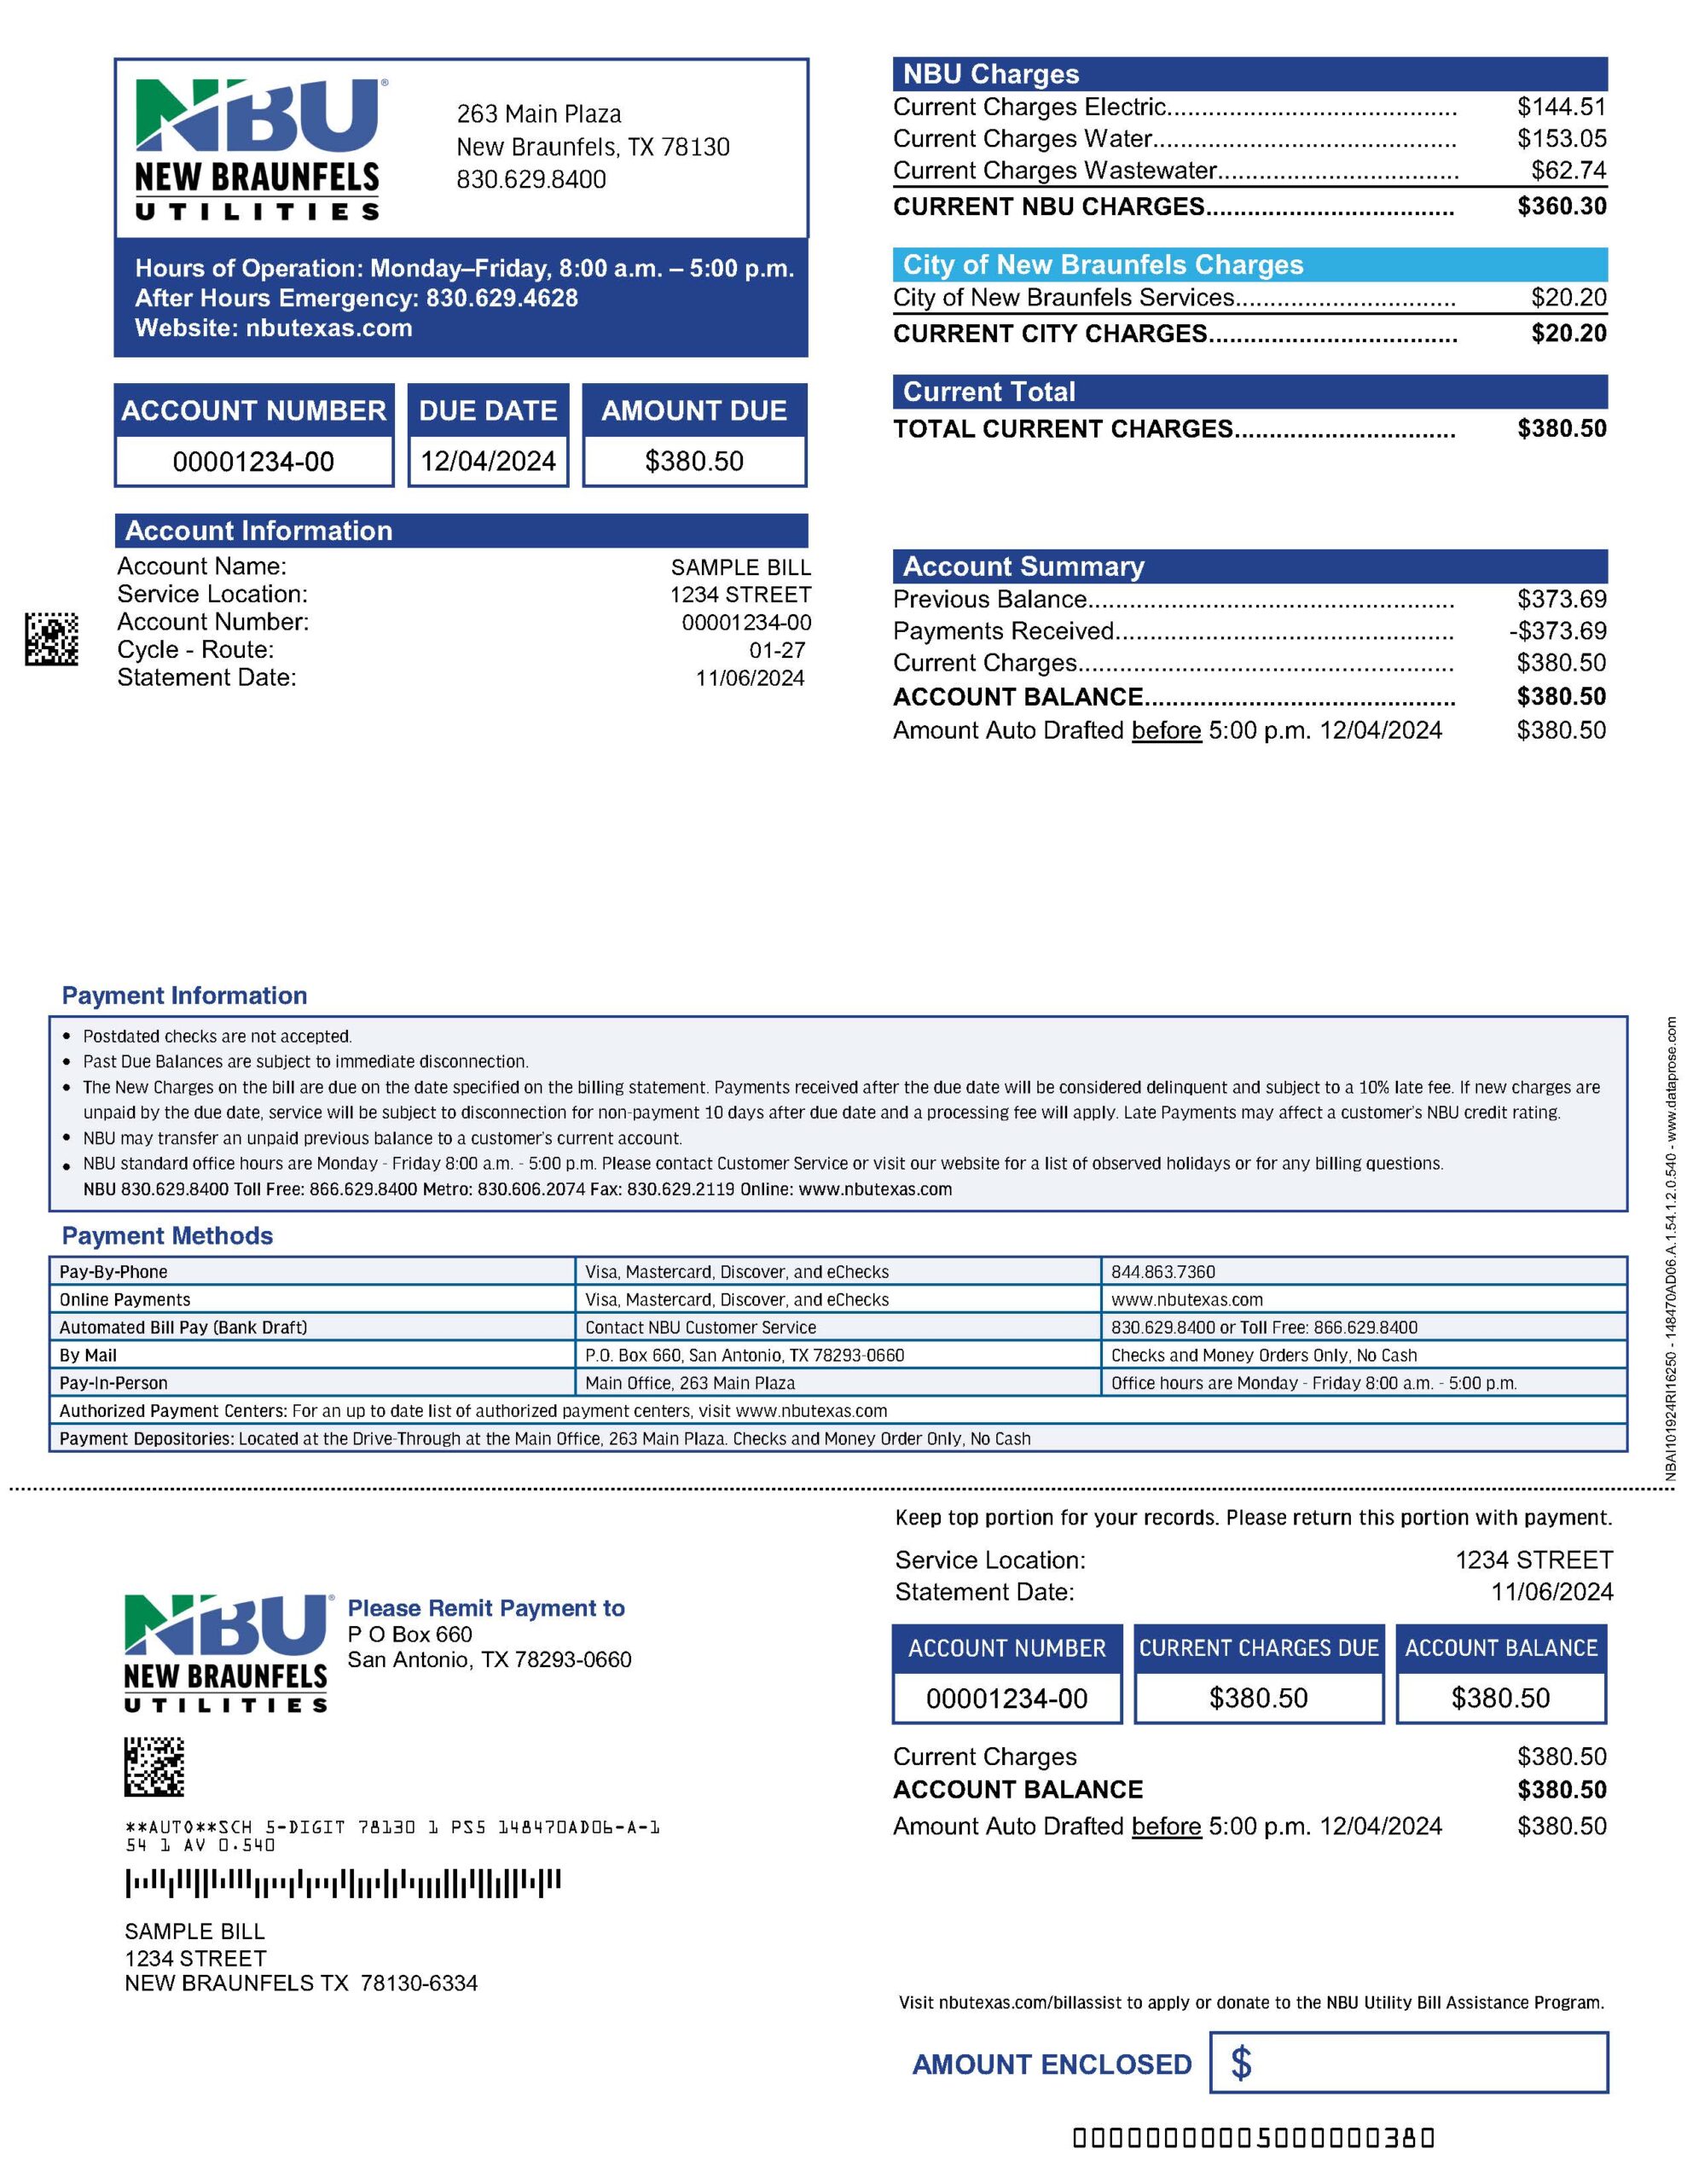
Total Current Charges
Total current charges equal all NBU service charges (electric, water, wastewater), Round Up Program contribution (if enrolled), and City of New Braunfels charges (recycling and garbage pickup) combined.
Account Information
This section displays information such as your name, address, account number, your current total amount due, and due date.
Account Summary and Balances
This section displays any unpaid charges, your current charges due and due date, and your total account balance. This information is repeated on the return coupon.
Return Coupon
The return coupon may be removed, and included when paying your bill.
Return Address
The return address reflects a San Antonio post office box. The bills will be delivered to a post office box location in San Antonio in a continuing effort to enhance security and increase efficiencies.
*This sample bill shows how information is organized on a typical residential statement. Your layout and charges may vary depending on your services and usage.
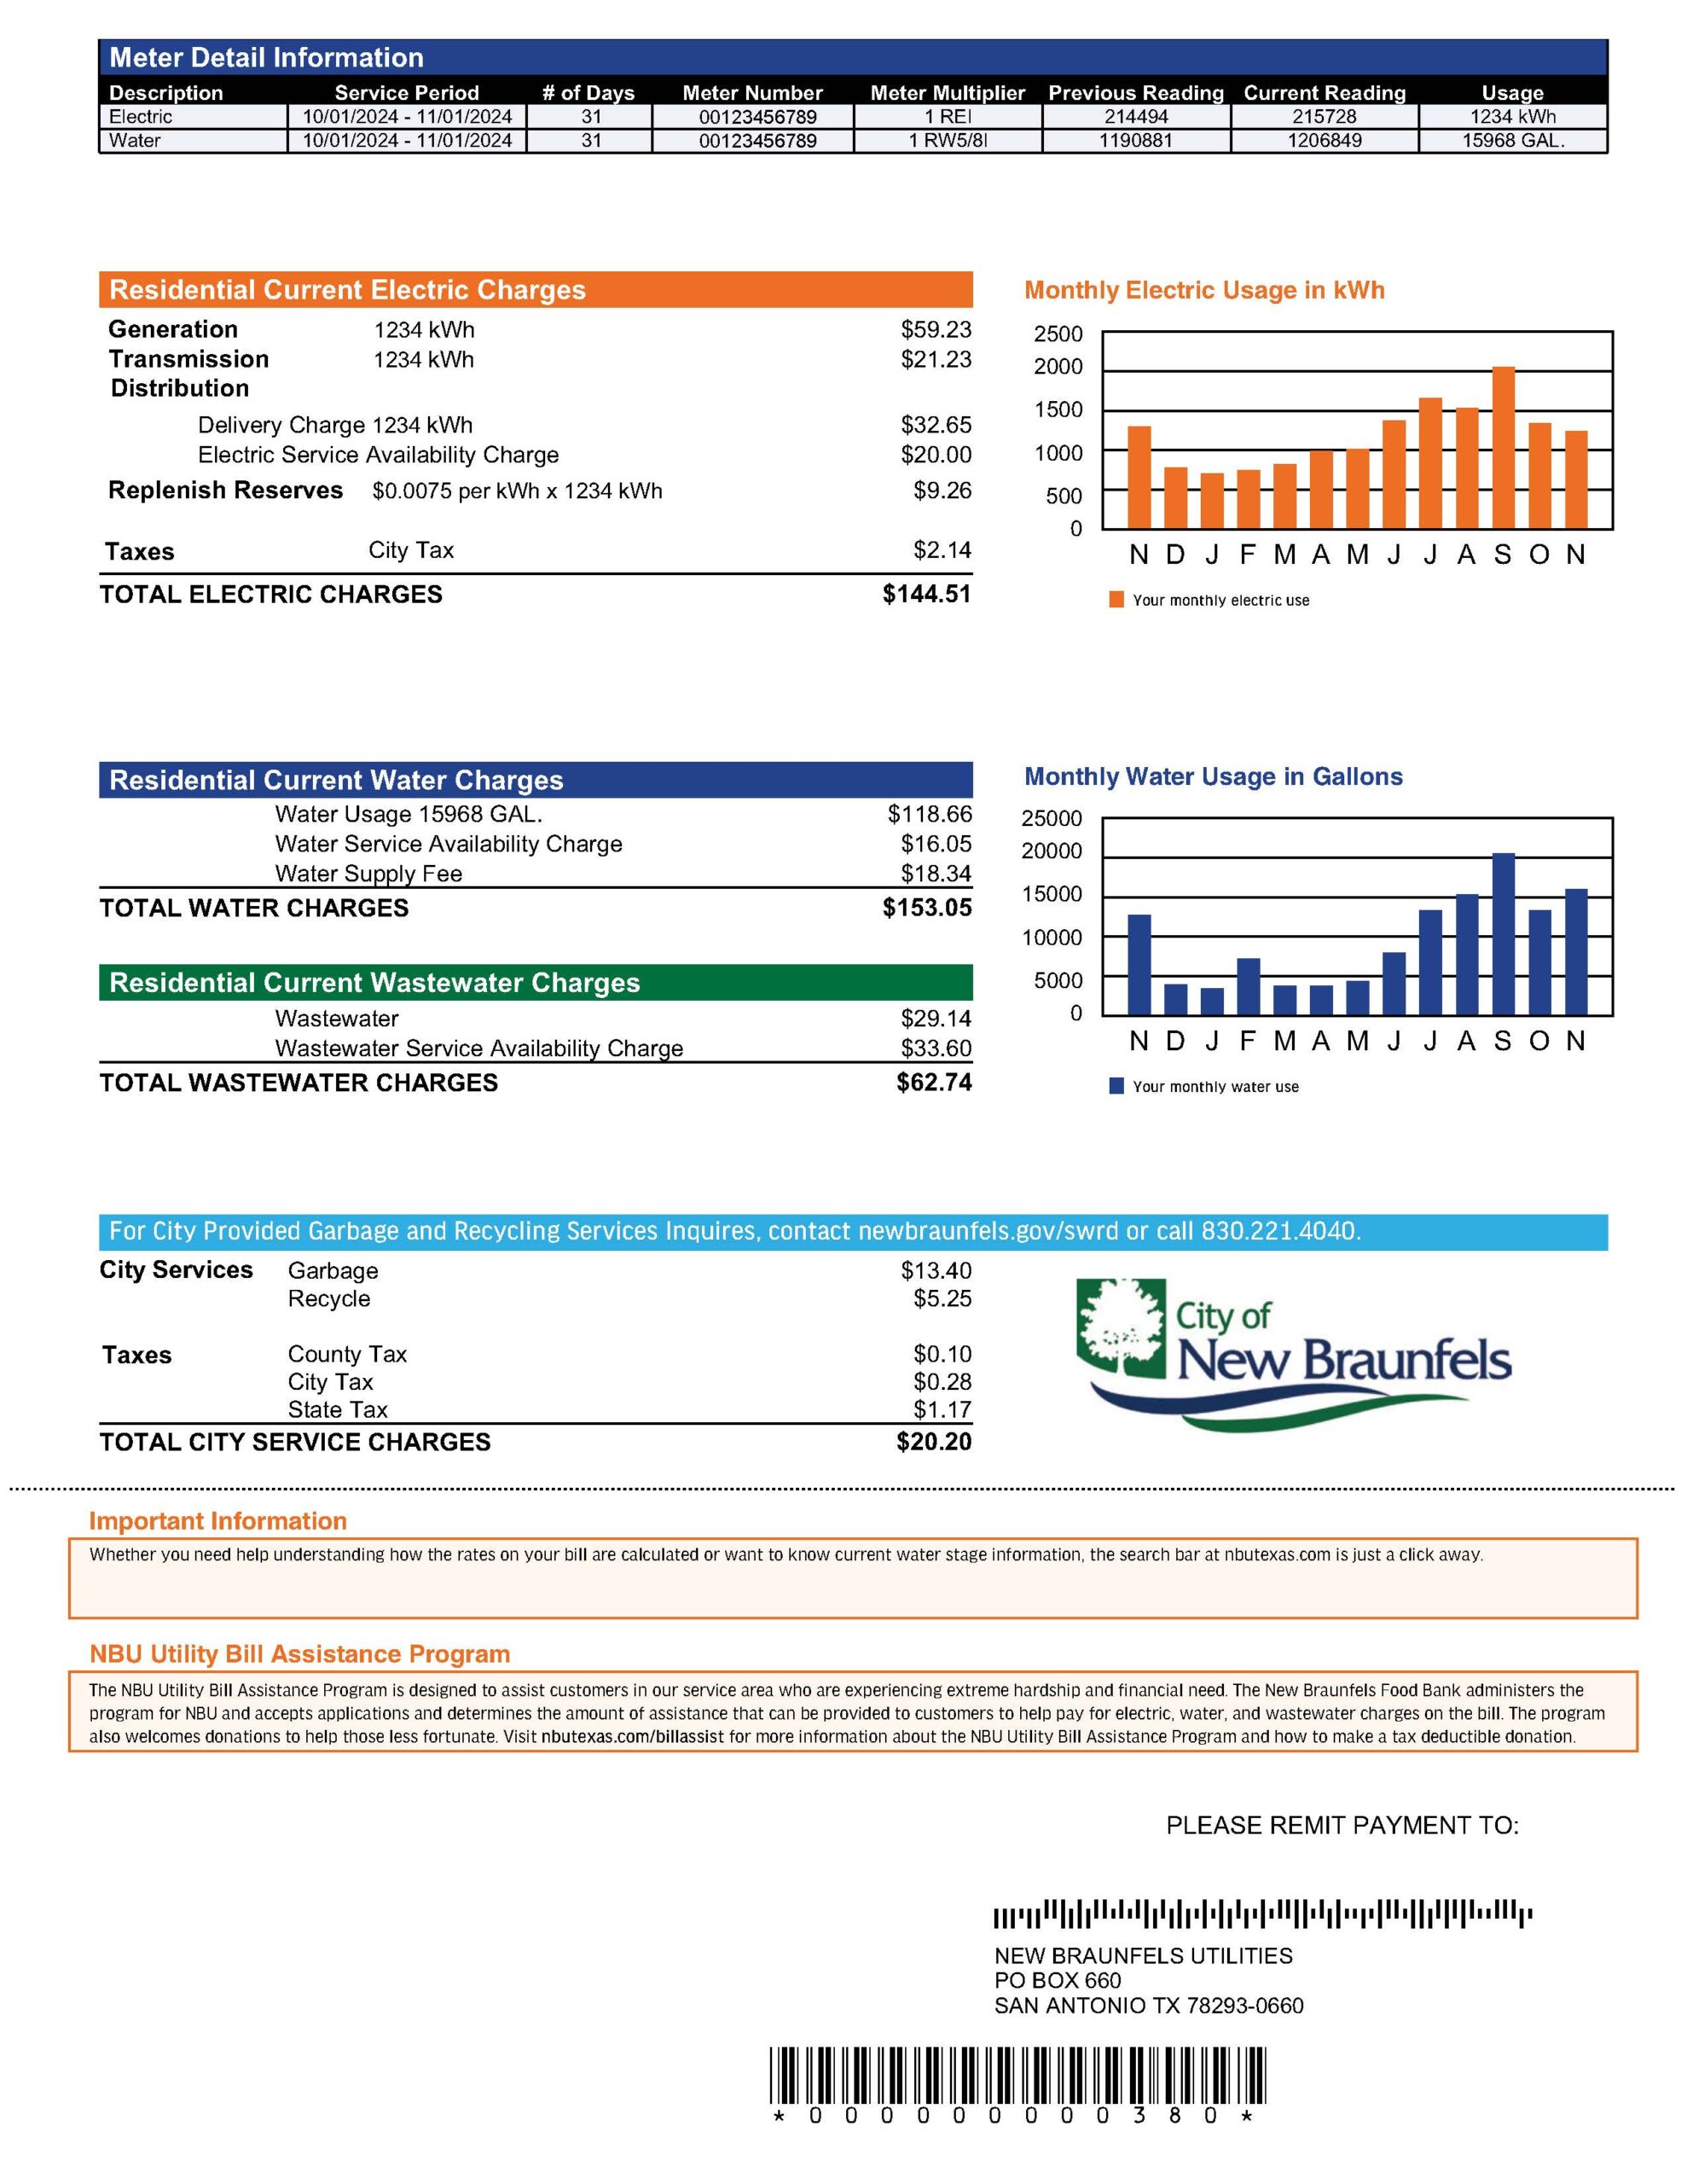
Generation
NBU does not own generation (power plants), so we buy all of our power from other markets. This charge reflects the pass-through amount for the actual cost of power NBU has purchased to serve its customers, and it is calculated using a per kilowatt-hour rate.
Transmission
Although NBU owns some transmission lines, the majority of the electricity we buy from the generators must be carried on other’s lines to our service territory. This is the actual cost of using those lines and is charged on a per kilowatt-hour rate. Transmission costs are set by the state each year and are based on our community’s peak electricity demand from the prior year’s summer.
Delivery Charge
Once the electricity enters NBU’s substations, the delivery lines that distribute electricity bring it to your home or business. This is the cost of maintaining the infrastructure (wear and tear) to carry and deliver electricity on a per kilowatt-hour basis.
Electric Service Availability Charge
This is a fixed monthly charge and includes the costs of making electricity available to your address – this includes all administrative costs, such as metering and billing and is charged regardless of how much electricity you consume. For example, regardless of the amount of electricity you use, the costs of maintaining the electrical equipment remain constant.
Replenish Reserves
This charge is designed to replenish NBU’s reserves to ensure we are prepared in case of emergency events – like Winter Storm Uri.
Water Usage
This is the actual cost for the gallons of water you use.
Water Service Availability Charge
This is a fixed monthly charge that includes the costs of making water available. A comprehensive system is used to deliver clean water to homes and businesses which must be maintained. This charge includes all administrative business costs, such as personnel, maintenance and infrastructure projects.
Water Supply Fee
This fee applies to specific water supplies and is charged on volumetric usage (gallons). This fee is not applied to essential use customers (customers who use up to 6,000/gallons per month of residential domestic usage, with no irrigation).
Wastewater
This cost is based on your three lowest water usage bills in the past 12 months. Irrigation is not a factor in the calculation, only essential use. For commercial customers, the charge is based on actual water usage.
Wastewater Service Availability Charge
This is a fixed monthly fee that includes the costs of removing and treating wastewater from your home or business. A comprehensive system is used to treat wastewater, which requires regular maintenance and upgrades. This includes all administrative business costs, such as personnel, maintenance, and infrastructure projects.
City of New Braunfels – Garbage and Recycling Services
New Braunfels Utilities bills for these City services. For service inquiries, contact the City of New Braunfels, 830.221.4040.
Special Information Section
This section is reserved for timely and important messages to help keep you informed with the latest updates and utility news.
Water & Electric Usage Charts by Month
These charts depict your historic monthly usage for the calendar year. They allow you to compare your monthly usage at a glance.
For an overview of charges you’ll find on your bill and how they relate to your services, watch our explainer video, or click each menu item below.
Want More Detail?
If you’d like to view your full bill, see a detailed breakdown of charges, or track your usage over time, you can do so through your online account.

We’re Here to Help
We’re neighbors serving neighbors—and we’re always happy to walk through your bill with you. If something doesn’t look right, or you have questions about your bill, our customer service team is here to help.